Data Labeling Quality in 2025: The Complete Playbook


Introduction: Data Labeling Quality
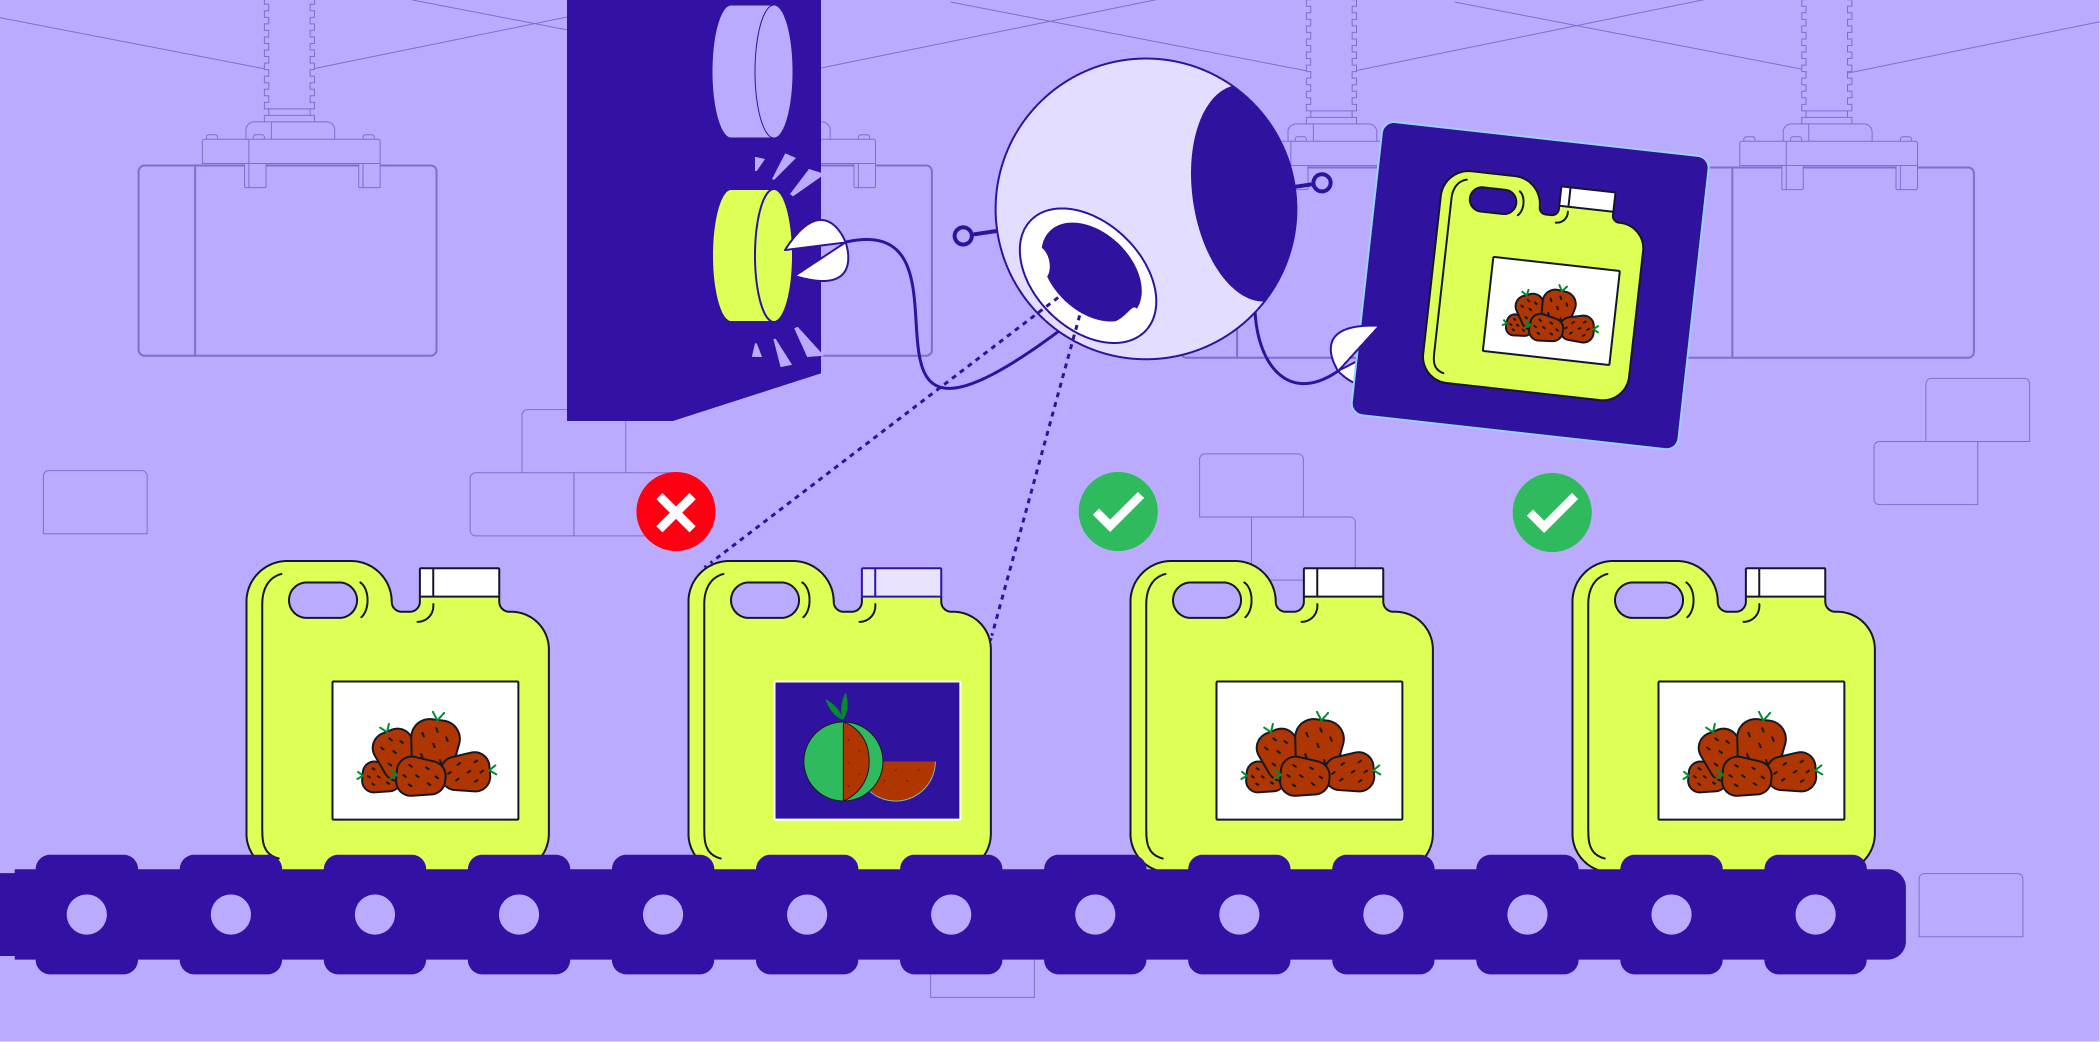
“Garbage in, garbage out” remains the most honest truth in AI.
After a decade of working with teams from fast-moving startups to Fortune 500 enterprises, we’ve seen a consistent pattern: when models fail, the issue is rarely the architecture, the algorithm, or the GPU stack. It’s the data.
More specifically, it’s the lack of high-quality, well-defined, consistently labeled data, the foundation of every reliable training dataset. In the era of data-centric AI, the fastest way to improve model performance isn’t more tuning or more parameters; it’s better data labeling and annotation quality.
Strong input data makes every downstream step easier: training becomes more stable, precision improves, edge cases stop breaking in production, and teams spend less on rework and firefighting.
The payoff is simple: predictable labeling quality, fewer corrections, and training data that moves models to production with confidence. For data ops leaders, that means treating annotation quality control as an AI priority, not an afterthought.
In this playbook, we break down why data labeling quality is the real driver of AI success, the hidden costs of poor data, and our own quality framework at Taskmonk we use for F500 AI implementations to embed accuracy, consistency, and coverage directly into the annotation workflow.
TL;DR:
Data quality drives model quality. Start with a clear quality strategy: versioned guidelines, early quality control gates, risk-based sampling, and shared data quality metrics. Use gold/honeypot tasks, inter-annotator agreement, and feedback loops to tighten decisions as you scale data annotation.
When data quality is embedded in the annotation workflow, you get reliable data labeling, fewer corrections, and high-quality data that ships on time. This playbook is for data ops leaders running large-scale AI data labeling programs and looking for reliable annotation quality control.
What Happens When Training Data Quality Is Poor?
Low training data quality harms both AI model performance and business outcomes.
Models trained on inconsistent, incomplete, or noisy labeled data display inflated validation scores, then miss in production with false positives rising, recall collapsing on long-tail cases, and teams burning time on retraining.
The business impact is immediate: delayed launch, high support costs, weak customer experiences, technical debt in downstream services, and eroded stakeholder trust. Most of these failures trace back to weak data labeling quality and the absence of enforceable quality control and data quality metrics.
Good performance of an AI model is important for every use case and industry, but the stakes are more critical for sensitive verticals like healthcare and finance that can have harmful effects.
In healthcare AI, poor data quality can lead to missed findings or incorrect triage when rare
classes are under-represented.
In finance, weak labels can cause costly false negatives (missed fraud) and alert fatigue from
false positives. Regulated teams also face compliance risk when audit trails cannot show how
labeled data was produced.
Defining Data Labeling Quality for AI teams, the Taskmonk Way
We define data labeling quality with three pillars—accuracy, consistency, and coverage because each addresses a different risk to the model performance and reliability.
Together, they turn subjective “looks good” into measurable, repeatable quality that scales.
In practice, we publish pillar targets per project, tie them to quality metrics and sampling rules, and treat misses as actionable signals
Let’s have a look at them:
Accuracy
Accuracy means each label conforms to the ontology and matches ground truth under clearly
stated rules.
For example In computer vision, we validate with class-specific IoU thresholds and tolerance bands for
small objects or crowded scenes; in NLP, we rely on exact match or span/token-level F1 to
account for boundary choices.
Accurate labeled data requires unambiguous definitions, worked examples, and explicit
handling for “unknown” or “not applicable” so annotators never guess.
We also separate content errors from guideline gaps in the error taxonomy, if many annotators
“miss,” the guideline, not the people, is usually the problem.
Consistency
Consistency is the likelihood that trained annotators would reach the same decision on the
same item.
We quantify it with inter-annotator agreement (Cohen’s or Fleiss’ kappa, Krippendorff’s alpha)
and set target bands by task subjectivity.
Regular calibration on gold/honeypot tasks, rationale logging for tricky calls, and reviewer
coaching prevent drift across shifts, time zones, and languages. High consistency lowers
variance and makes downstream evaluation reproducible.
Coverage
Coverage checks whether your data annotation actually represents the world your model will
see. We monitor class balance, per-class recall, long-tail representation, and multilingual or
cultural edge cases.
Without coverage, a dataset can be accurate and consistent yet still fail in production because
it never taught the model the boundaries that matter.
We treat systematic gaps—missing rare attributes, under-labeled small objects, skewed
demographics—as quality defects and route them to targeted collection or focused re-labeling.
Context matters a lot in data labeling quality.
For example: Autonomous driving needs precise geometry with high IoU and strict safety thresholds, while
e-commerce attributes are subjective and benefit from consensus, adjudication, and rich
examples.
A single accuracy number can hide class-level gaps. Link the three pillars—accuracy,
consistency, coverage to task-specific quality metrics, track inter-annotator agreement where
subjectivity is high, maintain gold sets with rotating honeypot tasks, and apply adaptive rules
(Percentage, Result Value, Dynamic Percentage) to vary sampling by risk.
That’s how clear definitions turn into operational data annotation that is measurable, auditable,
and fast.
Why Data Quality Measurement Is the Silent Differentiator in ML Success
High-performing models are a result of disciplined measurement. Without it, teams ship with
“looks fine” samples while defects hide in the long tail.
Measurement turns data quality into thresholds, alerts, and quality control gates that protect
production.
What goes wrong when you don’t measure:
- Subjective tasks drift because there’s no baseline inter-annotator agreement to anchor
decisions or trigger adjudication. - Ontology decisions start to diverge across annotators and regions, resulting in labeled
data splinters into inconsistent versions. - If classes are imbalanced, the model still misses many real cases, even when precision
looks good. - When reviews focus on speed instead of quality metrics, rework builds up and the
release gets delayed. - Without a live way to measure data quality or detect drift, teams discover poor data
quality only after training.
In practice, data labeling quality and overall training data quality are captured through a focused set of metrics and signals.
Data labeling Quality metrics:
At Taskmonk, we standardize a compact, high-signal set of data quality metrics encompassing end-to-end project metrics:
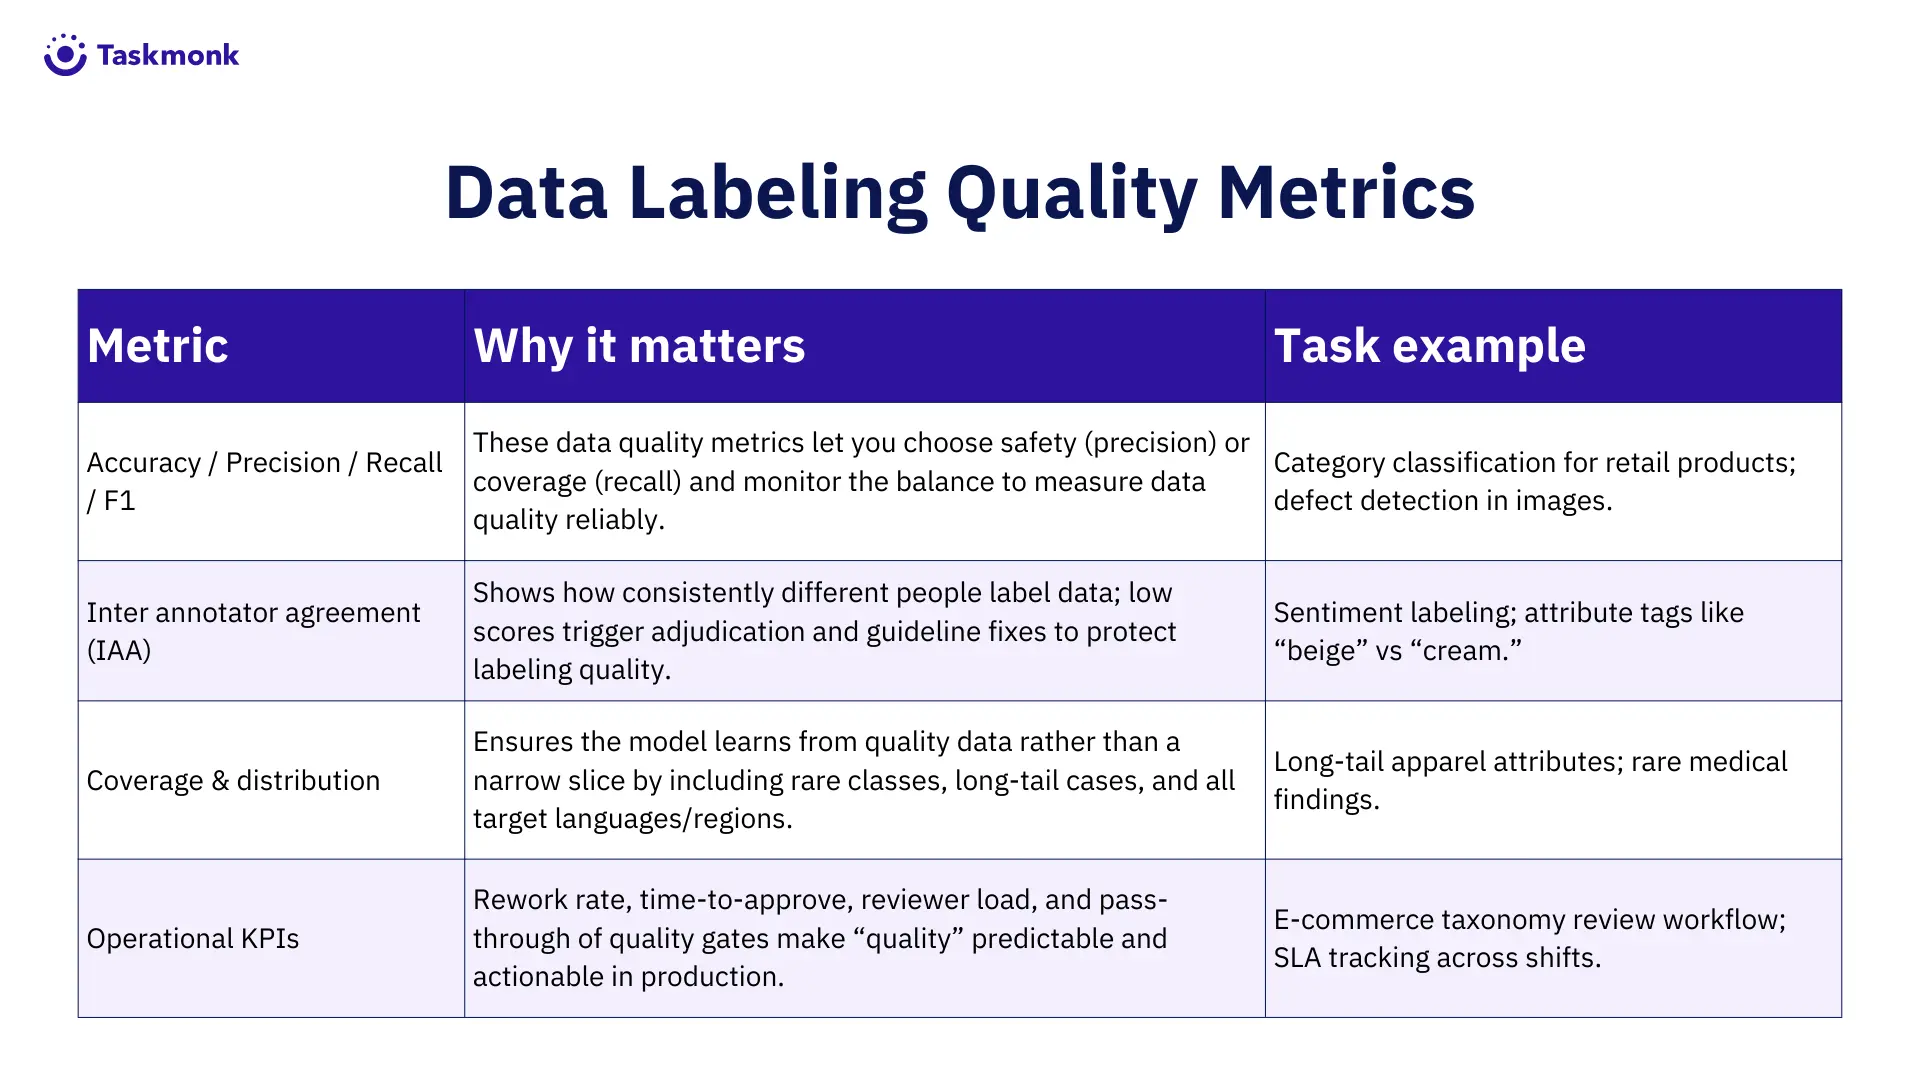
The Core Metrics Taskmonk Tracks
Quality becomes manageable when it is measured the same way, consistently. Taskmonk standardizes a compact set of data quality metrics and data quality KPIs that guide decisions across annotated datasets, not dashboards for their own sake
Accuracy, Precision, Recall, and F1
Accuracy answers whether the labeled data matches the ground truth at the item level. Precision and recall separate the cost of false positives from false negatives so teams can tune for risk. F1 balances the two when both errors matter.
We publish target bands per class so owners know exactly when to tighten guidelines or add examples. This keeps data labeling choices aligned with model objectives rather than generic “good enough” thresholds.
Inter-Annotator Agreement (IAA)
Consistency is measured with inter-annotator agreement (Cohen’s or Fleiss’ kappa, Krippendorff’s alpha, depending on task design). We set targets by subjectivity and escalate to adjudication if bands are missed.
IAA is paired with rationale logging, so disagreements feed the error taxonomy rather than becoming silent drift. This is essential for data annotation that spans time zones, languages, and rotating shifts.
Domain-Specific KPIs
Different modalities demand different lenses. Computer vision relies on IoU or mAP with size- and crowd-aware tolerances. NLP uses span- or token-level F1 for NER and exact match for structured extraction. Classification tracks sentiment match rate and per-class confusion. Speech tasks monitor WER/CER.
These KPIs sit beside the global metrics, so we measure data quality at the level where models actually fail.
Operational Quality Signals
We operate the pipeline with operational signals that keep speed and quality in balance: rework rate, time-to-approve, reviewer load, pass-through at each quality control gate, and the stability of class distributions. When any of these move, we adjust sampling, staffing, or routing before poor data quality accumulates.
Gold Sets and Honeypots
Every project maintains a curated gold set plus rotating honeypot tasks. Golds measure learning against unambiguous truth; honeypots detect fatigue, shortcutting, and ambiguous guideline edges.
Performance on both flows into the review score and cohort coaching. Together, they produce quality labeled data without resorting to blanket 100% review.
Golden batch tasks are completed at the same level on submission: golden batch tasks are marked as completed upon submission, instead of waiting to move to the next level. This ensures the golden set output is validated on completion of level 1 against the ground truth and does not go through the QC process. The result is faster calibration and feedback while preserving strong ground-truth validation.
The pattern is simple: define targets, sample intelligently, and act on the signal. This turns
metrics into outcomes like high-quality outputs, lower rework, and quality data annotation that
models can trust.
Together, these data quality metrics and data quality KPIs give you a consistent way to judge annotated datasets across projects and vendors.
Taskmonk’s Built-In Quality Framework
At Taskmonk we treat data labeling as a production system. Data annotation quality and training data qualityare embedded in the workflow.
We use rules, roles, and review to make data quality visible and repeatable: gold and honeypot
tasks to benchmark truth, sampling plans that adapt to risk, inter annotator agreement to
check consistency, and dashboards that help teams measure data quality in real time.
Three layers—methods, levels, and rules—work together to keep quality data flowing at
production speed.
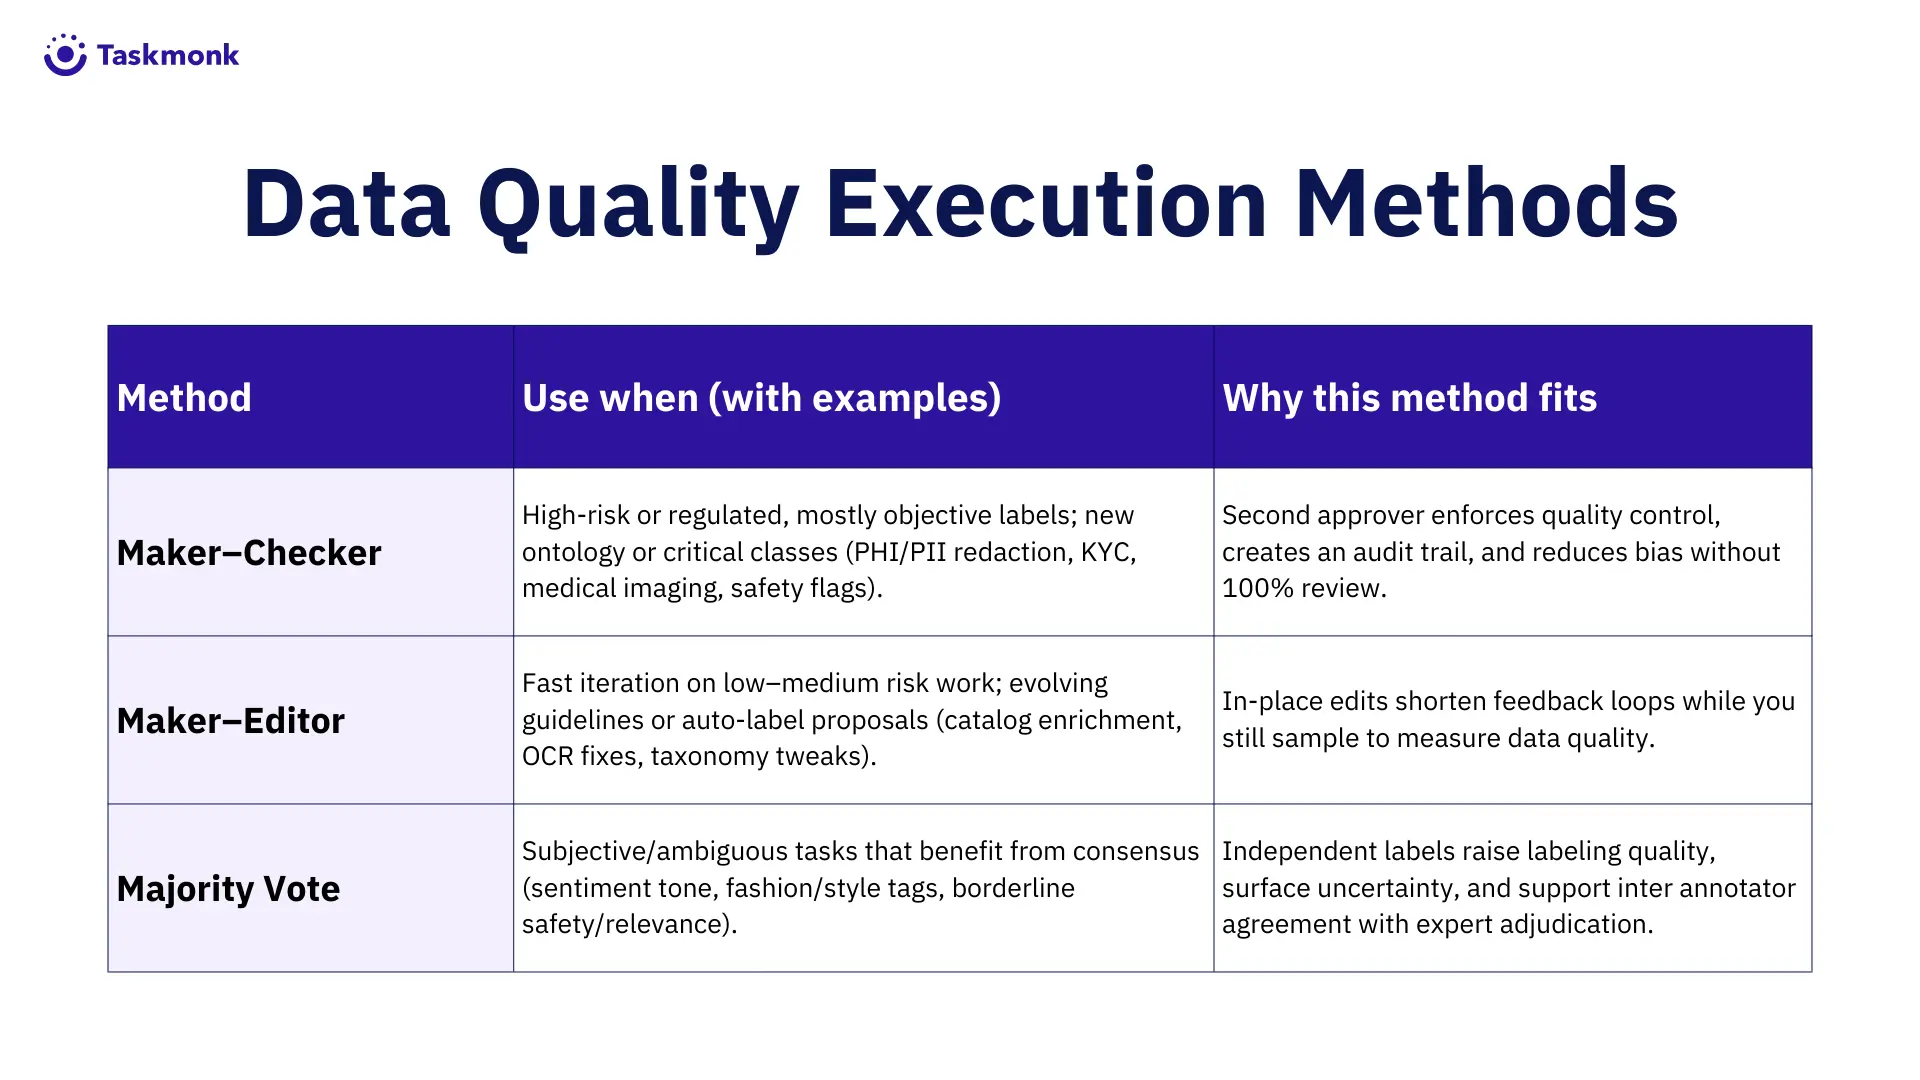
Execution Methods
- Maker–Checker. Labelers and approvers are separate roles with clear accountability.
This is the default for regulated or high-risk work, where a second set of eyes protects
downstream cost. - Maker–Editor. Editors correct in place when guidelines evolve quickly or when
automated proposals need light human confirmation. This shortens feedback loops
without sacrificing quality control. - Majority Vote. Multiple independent labels create consensus for subjective tasks.
Expert adjudication resolves ties, and the decision becomes a worked example in the
guideline library. This approach lifts labeling quality when subjectivity is inherent.
Recently, a new Affinity feature has been made available for the Majority Vote model. Affinity measures how well an annotator’s labels align with prior consensus on similar items. Task assignment uses this affinity to route tasks to annotators with proven strength on specific product types or domains, improving productivity, reducing onboarding time for repetitive tasks, and ensuring more consistent consensus quality.
Execution Levels
Quality is enforced across stages, not in a single pass. Initial labeling flows into QC and, if
required, into audit. Bulk-action limits prevent rubber-stamping.
Skip/Reject permissions capture ambiguous inputs without penalizing careful work. Guidelines
are versioned, and every action writes an audit trail.
Cohort-specific targets keep distributed teams aligned while allowing experienced annotators
to move faster on stable classes. The outcome is predictable throughput with quality baked in.
Process Logic Rules
Rules route the right work to the right reviewer at the right time. They are configurable per
project and can change as the data changes.
- Percentage Rule: Sample a defined share of items for review; increase sampling for
risky classes or new ontologies. - User Attribute Rule: Route by skill, language, domain badge, or reviewer review score
so complex tasks are assigned to qualified expert annotators. - Result Value Rule: Trigger extra checks for rare classes, boundary values, or
low-confidence predictions. - Result Match Rule: Auto-accept when labels match model predictions or gold within
tolerance; escalate when they do not. - Dynamic Percentage Rule: Evaluates a user’s rolling average accuracy over the past month in a project to determine QC sampling rates—ensuring higher sampling for new or less accurate users and minimal sampling for high-accuracy users, optimizing annotation level costs & quality.
Underneath the rules, Taskmonk maintains per-class targets, rotating golds, and drift monitors. When distributions shift or a reviewer’s trend dips, the system raises sampling, routes to senior reviewers, or pauses a slice of work for clarification.
The framework makes quality metrics actionable and keeps data labeling efficient. You get quality labeled data at scale without trading speed for confidence.
Measuring Quality Across Distributed Teams
Distributed work adds three risks: uneven domain depth, language and cultural nuance, and
time-zone gaps. We address them with versioned guidelines that include local examples, a
shared gold set with rotating honeypot tasks, and cross-cohort calibration so inter annotator
agreement is comparable. Rationales are logged on difficult calls, turning fixes into guidance
the whole team can reuse.
The goal is consistent data annotation that yields high quality labeled data regardless of where
teams sit.
Operationally, we balance queues before handoffs, set SLAs to keep time-to-approve
predictable, and monitor reviewer load so quality control doesn’t stall.
User Attribute Rules route domain or language tasks to qualified annotators, while live data
quality signals—IAA trendlines, rework, and spot checks on long-tail items—trigger faster
coaching or temporary sampling increases.
The result is steady, production-ready data labeling quality across distributed shifts without
trading speed for confidence.
Continuous Quality Improvement in the Taskmonk System
Quality is not a gate at the end; it is a loop.
Taskmonk’s training data quality loop has the following steps: establish baselines, set targets, automate checks, review retros, and act on drift.
This is how we continuously improve labeled data quality in the Taskmonk platform.
- Establish baselines
Create a stratified gold set and publish per-class targets for accuracy, precision/recall,
F1, and inter annotator agreement—these data quality metrics guide daily decisions. - Wire targets to quality gates
Attach rules to the targets: Percentage Rule for routine sampling, Result Match Rule to
auto-accept within tolerance, and Result Value Rule for historically weak or rare
classes. - Automate detection
Dashboards measure data quality continuously—watching class distributions, IAA
trendlines, reviewer scores, and rework in real time—with alerts when thresholds are
breached. - Run cadence reviews
Quarterly retros use an error taxonomy to separate content mistakes from guideline
gaps. They update the ontology, add examples, or adjust routing so that quality-labeled
data becomes the default. - Act on drift
When distributions change (new product line, language, device), the Dynamic
Percentage Rule increases sampling and opens a temporary audit stage until metrics
return to target. - AI models
For text and image annotation projects, integrated AI models like Llama and YOLO
inside Taskmonk help reduce a huge chunk of L1 work and labeler subjectivity.
Example- Image detection models capture attributes from images like quality, explicit
content, etc, with an ~80% accuracy, and save time.
Key Takeaways for Data Ops Leaders (Checklist)
- Define quality in your context: accuracy, consistency, coverage—and link each pillar to
concrete quality metrics. - Track a decisive set of data quality metrics: accuracy, precision/recall, F1, inter
annotator agreement; add domain KPIs (IoU, span-F1, WER/CER). - Pick execution methods by risk: Maker–Checker, Maker–Editor, Majority Vote (mix as
needed for objective vs. subjective work). - Encode rules where they matter: Percentage, User Attribute, Result Value, Result
Match, Dynamic Percentage—your workflow-native quality gates. - Maintain truth and guidance: curated gold sets, rotating honeypot tasks, reviewer
rationales, versioned guidelines, and audit trails for repeatable quality data annotation. - Run operations as a system: plan for distributed teams (calibration, timezone-aware
handoffs), and monitor rework rate, time-to-approve, queue health, and reviewer
load—then route by skill/language. - Close the loop continuously: baseline, target, instrument, review, and act on drift to
keep producing high quality labeled data at scale.
Conclusion
High-performing AI doesn’t happen by accident.
It happens when organizations treat training data with the same rigor, governance, and operational discipline they apply to their production systems. The most advanced teams we work with globally across retail, finance, logistics, healthcare, and industrial AI—have all learned the same lesson: data labeling quality is the strongest lever for predictable model performance.
When quality is inconsistent, models become unstable, edge cases break, and teams fall into an expensive cycle of retraining and re-labeling. But when quality is built into the workflow from day one—through clear guidelines, calibrated annotators, measurable targets, and adaptive QC rules—everything downstream becomes faster, cheaper, and far more reliable.
This is exactly what Taskmonk’s framework is designed for.
Dynamic Percentage Rules eliminate waste in QC while tightening control where risk is highest.
Batch-wise sampling prevents quality regressions as datasets grow. Affinity-based Majority Vote turns consensus into a strength—not a bottleneck. Golden batches accelerate calibration without compromising ground truth.
These aren’t shortcuts—they’re production-grade quality systems used by teams who cannot afford mislabeled data or delayed releases.
If you’re scaling annotation in 2026, whether you’re evaluating AI annotation companies or running your own in-house stack, now is the right time to shift from ad-hoc review to a governed, metrics-driven quality framework. Taskmonk can help you build and run a labeling system where accuracy is measurable, consistency is repeatable, and coverage is intentional—so your models can perform optimally in the real world.
Talk to our experts and see how top 1% teams are building trustworthy training data with Taskmonk.
FAQs

%20(1).png)